“The goal is to turn data into information, and information into insight.”
Carly Fiorina, former executive, president, and chair of Hewlett-Packard Co.
Google Analytics has been a revolutionary tool and one of the first web tracking analytics tools. It continues to be one of the most important ones in the larger market. Startups can track different metrics and it is available here. Despite the ubiquitous nature, there are certain issues with Google Analytics as a tool kit.
Generic Google Analytics Dashboard

Google Analytics can be quite an overwhelming dashboard to check out for the first user. Since it collects a great deal of data and requires you to be a web analytic expert in using it. It’s excellent for knowing which keywords your site ranks for and who sees it. But with an increasing number of browsers disabling third-party cookies, it’s losing a lot of traffic.
Google Ecosystem
There has been quite a movement in the ecosystem to break out of the Google ecosystem’s set of tools and encourage other tools. Because to fill the gaps in Google Analytics, you’ll need to use a tool like Google Tag Manager. It’s a platform that nests and manages all of your tags, including conversion pixels and website analytics. Thereby, it allows you to measure everything you need without modifying your website code!
Google Tag Manager also allows you to measure other aspects of your business that are missing from Google Analytics – like products, sales revenue, and even mobile traffic.
Overwhelming
Data Visualisation can seem complicated and obscure for people with a non-maths background. A basic understanding of statistics etc can be useful to interpret the data better. Wide applicability in multiple environments makes it so hard for a beginner user
All kinds of blogs, and e-commerce sites can deploy and use these tools:
- KPIs will differ based on the type of site.
- You can’t customise GA based on what your site does.
- Will have to comb through the haystack of menus and irrelevant data to find the needle you are looking for.
A lot of companies that even have GA never look at it, as they can’t turn data into actionable insights. The story gets difficult to decipher.
What can be done about issues?
These issues with Google Analytics can be resolved by either:
- Hiring a Google Analytics expert in-house may not be worth the ROI.
- Get a consultant to help out from time to time.
- The third option is
To outsource all your information and crush it with the help of simple tools, narrative BI is one such tool. The main problem that GA users face is turning the data into insights. Narrative BI makes it easy to sift through this data and take action fast.
What is Narrative BI?
Narrative BI for Google Analytics is an intuitive, lightweight no-code analytics platform. It effortlessly integrates with Google Analytics which can be disastrous in complexity and user experience. Especially for new teams.
Narrative BI automatically turns raw data into actionable narratives helping you keep track of your crucial GA metrics. It lets you understand your Google Analytics data in just seconds, providing easy-to-read narratives for actionable insights and anomalies directly via Slack or email.
- Personalised Insights: Adding KPIs, goals, and milestones in the tool is very easy and you get a tailored feed of insights that matter to you and your role at the company.
- Decision Making becomes Faster: Insights can be discussed right in the tool without the hassle of constantly switching software and social media and saves you time.
- Eliminate Dependency: Non-technical users often struggle with the time it takes to gain insight from their data. Insights without a technical team allow to reduce dependency and make teams more mobile.
- Insights in favoured language: Narrative BI speaks the language the user favours through their Natural Language Generation Engine, users can get insights in plain English.
Narrative BI on Google Analytics

Lot more simplified and easier on the eye. With a cleaner interface, it makes it easier to understand the direction of the business.
Different components
The dashboard is a lot simpler with fewer components and condensed information.

Anomaly Detection

Here we have two pieces of information, one from Nov 25 and the other from Nov 23, and are repeating all the sudden and unexpected changes on the page. It may be both negative or positive but it reports the changes accordingly.
Narrative Story
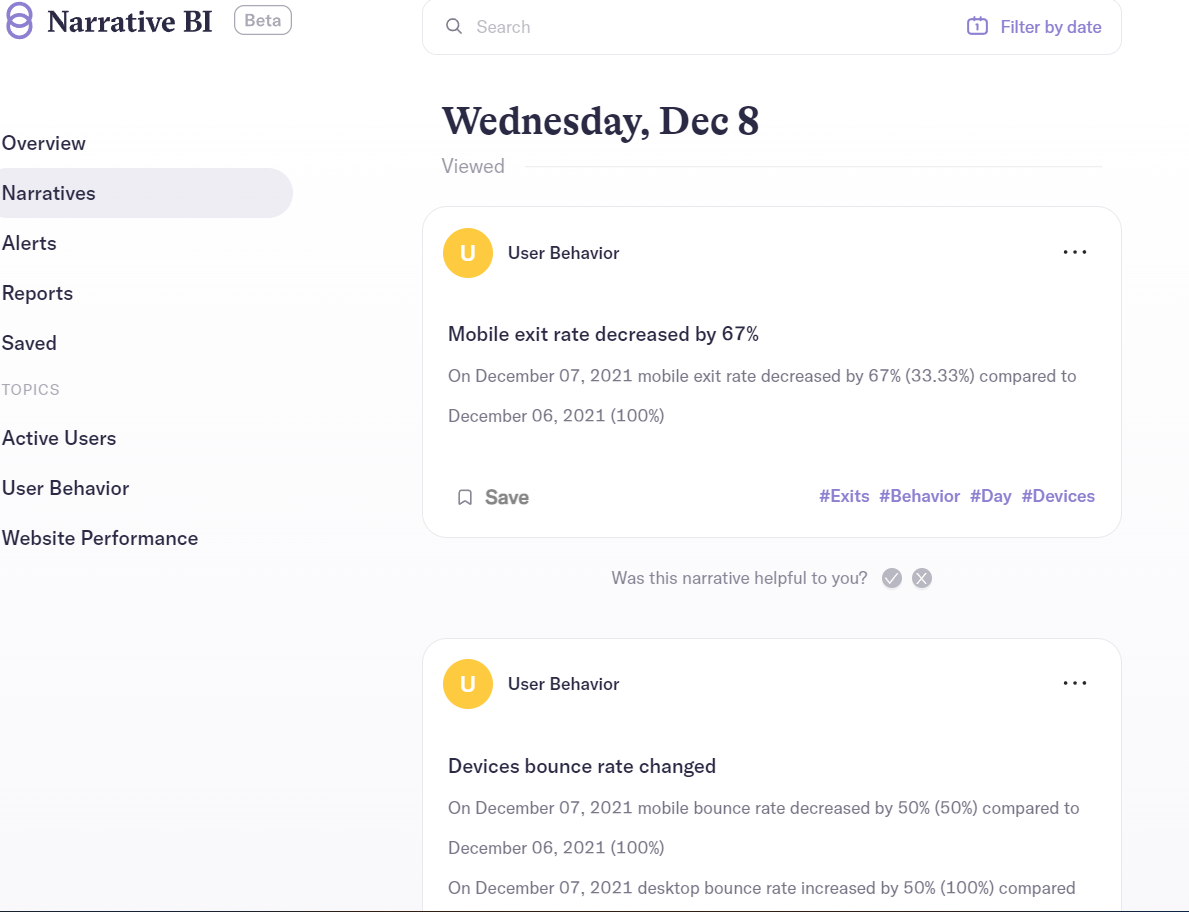
Here in the above image, you can see that the information is simplified and thereby easy to understand text format. It also discusses important things such as mobile exit rate and bounce rate(no of users leaving your website within the 30s). Problems can be targeted directly instead of being caged.
Reports
Below is a screenshot of what I got from the analytics of my website and I can say for sure things are going in the right direction.

The save button will save all the actions and can be reviewed later. Both newbies and data-savvy audiences can make use of Narrative BI.
- No IT or data scientist involvement. No special skills are required.
- It is easy to use and understand with no training or prior experience necessary.
- Narrative BI cuts through the noise by presenting all the critical website traffic insights and metrics within a single platform.